The planet closest to the Sun hides a striking contrast
Mercury is the planet closest to the Sun, but its surface does not have one uniform temperature. Sunlit ground can reach about 430 °C, while night-time temperatures can fall to around −180 °C. These figures describe environmental extremes; they are not live measurements. Its exosphere, an extremely sparse envelope of atoms, does not behave like Earth’s atmosphere. To understand the ice, we therefore need to examine individual locations and how they are illuminated, rather than imagine a single temperature applying across the entire planet.
Cold traps at the poles
Mercury’s rotation axis is almost perpendicular to its orbital plane. Near the poles, sunlight consequently arrives very low on the horizon, allowing crater walls to shield parts of the floor. Some places never receive direct sunlight at all. Where the thermal conditions allow it, these regions become cold traps: locations in which volatile substances can remain frozen for long periods. Local geometry is the crucial factor. Distance from the Sun alone does not describe the thermal environment on a permanently shadowed crater floor, even on the innermost planet.
Before the spacecraft: clues from radar
The story began before MESSENGER arrived. Earth-based radar observations revealed polar regions that returned unusually strong signals with properties consistent with ice. Radar transmits radio waves and examines the returning signal; it does not take a photograph of a white landscape. NASA’s historical account describes observations using Arecibo as well as Goldstone and the Very Large Array. At that stage, ice was an explanation to test, rather than a conclusion reached by directly examining a water sample. The distinction matters when reading the earliest reports of the discovery.
MESSENGER turned clues into an orbital investigation
MESSENGER entered orbit around Mercury on 18 March 2011, using the date in Universal Time. It became the first spacecraft to orbit the planet and investigated it for more than four years, until the mission ended in 2015. Images and measurements from orbit made it possible to compare the terrain with the earlier radar signals. The advantage was more than simply getting closer: different instruments could investigate the same environment in complementary ways. These results come from a completed mission whose archived observations remain available for scientific research.
What the neutrons revealed
One essential piece of evidence came from the neutron spectrometer. The study by Lawrence and colleagues, published online in November 2012, reported a decrease in particular neutron populations emerging from the northern polar region, consistent with hydrogen-rich material. The instrument was not reading a chemical formula directly from the ground: it measured a signal that required interpretation through models. Combining that result with radar data, the authors found the best match was a buried layer of nearly pure water ice. The identification depended on different observations pointing towards the same explanation.
A laser to reconstruct the landscape
The Mercury Laser Altimeter measured the distance between the spacecraft and the surface. Knowing the vehicle’s position and orientation allowed researchers to locate those measurements on Mercury and construct maps of ground elevation. NASA continues to preserve and improve these products after the mission’s end. A topographic map does more than describe how deep a crater is: it supplies the geometry needed to calculate which walls and floors can receive sunlight. It shows how a distance measurement can become a tool for understanding where ice can survive.
Thermal models explain where ice can last
The research presented in 2012 did not rely on a single instrument. The mission team combined excess hydrogen, the near-infrared reflectance of the deposits, and models of surface and subsurface temperatures based on actual topography. A thermal model calculates expected conditions from the properties and geometry being considered. It is not equivalent to leaving a thermometer inside every crater. Its strength lies in comparison: places where ice was predicted to be stable matched evidence independently measured by other instruments. The explanation became stronger because the methods could be checked against one another.
Exposed ice and hidden ice
The observations indicated an important difference between deposits. In the coldest locations, ice can be exposed at the surface; elsewhere, a dark layer covers and insulates it. The NASA/JPL release of 29 November 2012 explicitly distinguishes these situations and describes an organic component in the dark material as likely, rather than as a definitive chemical identification. Delivery of water and other volatile materials by comets or volatile-rich asteroids is also a proposed explanation. It should not be turned into a supposedly certain account of one particular impact witnessed by the spacecraft.
How to photograph something in permanent shadow
In 2014, the team announced the first optical images of deposits inside permanently shadowed craters. The wide-angle camera used extremely faint light scattered from illuminated walls. Permanent shadow therefore means an absence of direct sunlight, not an absolute inability to receive photons. Observations of Prokofiev crater revealed surfaces with distinctive reflectance properties, while other locations showed sharply bounded dark deposits. These images added information about the materials’ shape and distribution. They did not replace the earlier evidence, but allowed researchers to ask more detailed questions about how the deposits had developed over time.
Not every shadow tells the same story
A 2016 study compared shadowed regions identified in images with those calculated from altimetry. The two methods agreed closely, and large radar-bright deposits coincided with sheltered areas. However, many shadowed locations did not contain a radar-bright deposit. The explanations discussed included limitations imposed by the observing geometry, potentially thicker covering layers, and the possibility that ice was absent. The lesson is practical: identifying an environment suitable for preservation does not, on its own, establish a definite quantity of water there. Observational coverage and the properties of the covering material also matter.
Research reaches below the resolution of the images
Cold traps do not necessarily have to occupy the floor of a large crater. A scientific contribution preserved in NASA’s archive in 2017 investigated the possible role of small irregularities and depressions. It combined measured reflectance with models of rough surfaces to infer an ice distribution at scales smaller than the resolution of the available measurements. That step matters: these results come from modelling, rather than resolved photographs of every small deposit. A map’s scale determines which details can be observed directly and which must be investigated through additional scientific inference.
Reading the photographs carefully, too
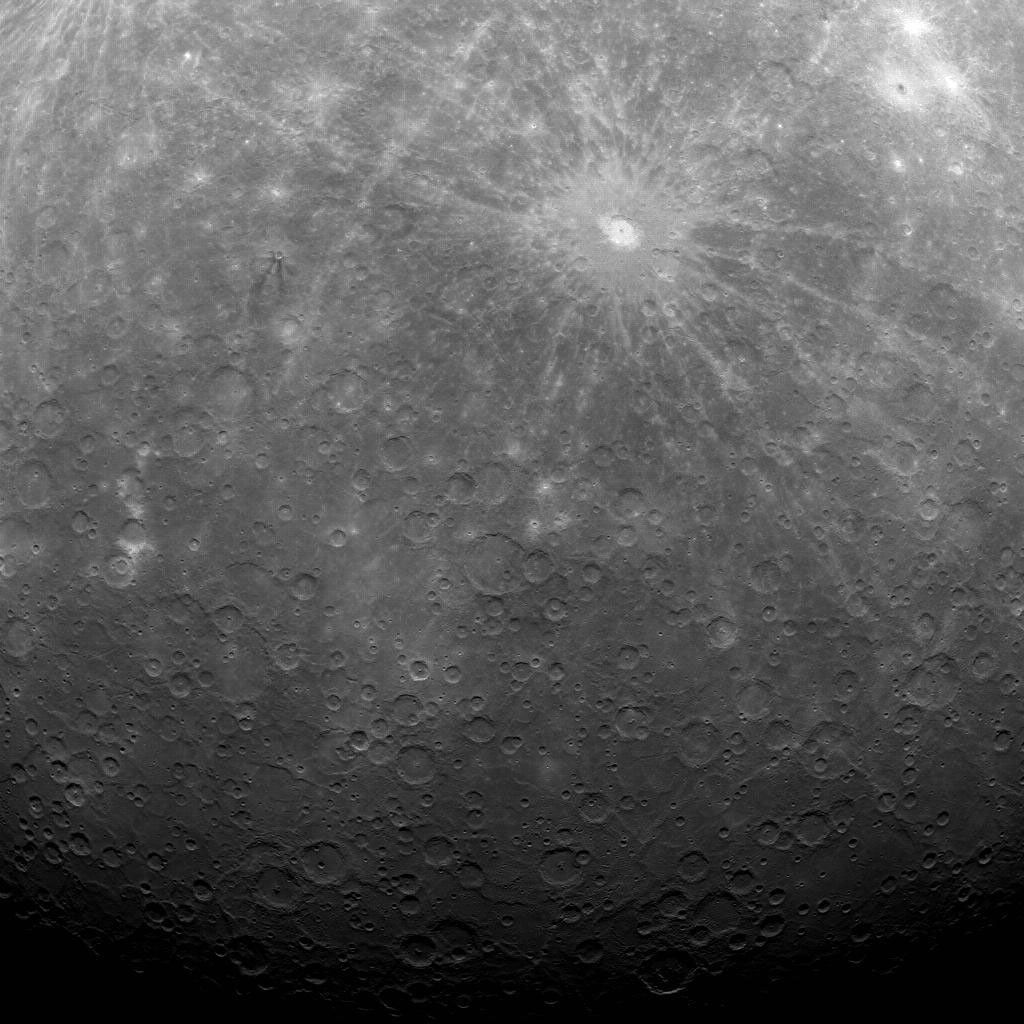
The opening image is a real photograph taken by MESSENGER on 29 March 2011, the first obtained from Mercury orbit. It shows cratered terrain, Debussy crater with its bright rays and, towards the bottom, a region near the south pole. It is not a photograph of the north polar ice deposits. Making that distinction prevents an attractive cover from being mistaken for evidence it does not actually provide. In planetary exploration, the acquisition date, instrument and location are as much a part of the scientific information as the features visible in the pixels.
Sources and further reading (12)
- science.nasa.gov · facts
- lasp.colorado.edu · messenger finds polar ice on mercury
- science.nasa.gov · messenger
- nssdc.gsfc.nasa.gov · ice mercury
- pubmed.ncbi.nlm.nih.gov · 23196909
- pgda.gsfc.nasa.gov · 87
- jhuapl.edu · 121129 messenger finds new evidence water ice mercurys poles
- jpl.nasa.gov · nasa spacecraft finds new mercury water ice evidence
- jhuapl.edu · 141015 messenger provides first optical images ice near mercurys north pole
- ntrs.nasa.gov · 20160008397.pdf
- ntrs.nasa.gov · 20170002418.pdf
- science.nasa.gov · first image ever obtained from mercury orbit
Sources checked: 2026-11-22.