A planet hidden from view
Venus is close to Earth and can shine brilliantly in our sky, but observing its ground from orbit is a different challenge. Its dense atmosphere and clouds hide the surface from visible light. Detailed mapping therefore required an instrument that could investigate the terrain through that cover. NASA’s Magellan mission used radar, transmitting radio waves and collecting the returning echoes. That choice transformed our knowledge of plains, mountains and volcanoes, revealing a world that an ordinary photograph of the cloud tops could not show to scientists studying the planet’s geology.
Departing aboard Atlantis
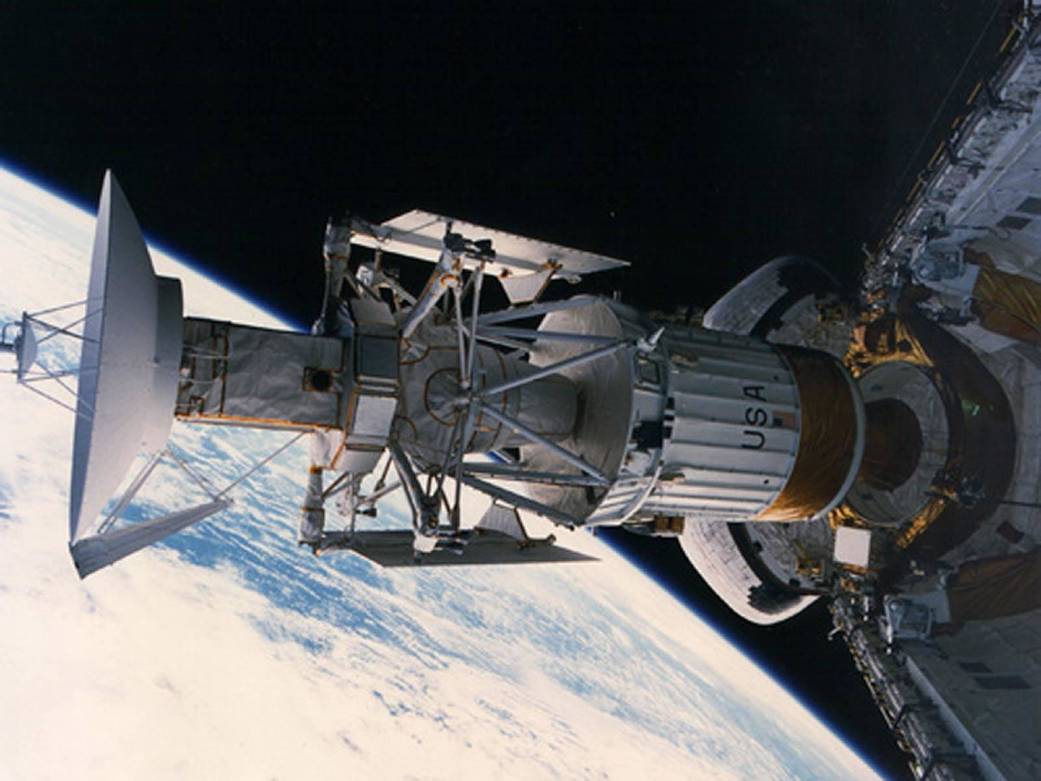
Magellan launched aboard Space Shuttle Atlantis on 4 May 1989 during mission STS-30. It became the first planetary spacecraft launched from a shuttle. The spacecraft and its Inertial Upper Stage propulsion system were taken into Earth orbit before being sent towards Venus. The cover photograph documents that phase of the mission in 1989: it shows real hardware beside Atlantis’s cargo bay, rather than a reconstruction of the Venusian surface. The story connects a crewed flight in Earth orbit with robotic interplanetary exploration, while preserving the distinction between their vehicles and responsibilities.
From an orbit to strips of a map
The spacecraft entered orbit around Venus on 10 August 1990. Mapping required repeated observations rather than a single photograph of the entire planet. During its passes, the instrument collected measurements over portions of the surface; the spacecraft’s motion and Venus’s rotation progressively extended the coverage. Later cycles filled gaps and added observations useful for comparison. By the third cycle, coverage had reached 98 per cent of the surface. The result was an archive of measurements that could be organised into maps, with particular acquisition times and viewing geometries associated with the data.
What synthetic aperture means
The technique is called synthetic aperture radar, abbreviated SAR. A radar antenna transmits a signal and receives reflected energy; SAR processing combines observations collected as the platform moves. This creates the effect of a longer antenna along the direction of flight, improving the ability to distinguish detail. “Synthetic” does not mean that the landscape is invented. It describes how measured signals are combined. NASA’s explanation of the technique connects orbital motion with the quality of the resulting image, showing why processing is an essential part of the measurement rather than merely a cosmetic step.
A bright area is not necessarily hotter
Brightness in a radar map describes the signal returned towards the instrument. It depends on surface properties and viewing geometry, rather than directly photographing temperature. A surface that is rough at the radar’s wavelength scale can produce a strong return; slopes and orientation also affect the appearance of terrain. Comparing two maps therefore takes more than looking for a new bright patch. Researchers must consider what may have changed on the ground and what could instead result from a different viewing angle or measurement conditions affecting the radar signal returned to the spacecraft.
Height, images and distinct scientific products
The Planetary Data System’s Magellan archive preserves different categories of products, including radar images, altimetry and gravity information. These are not interchangeable names for the same photograph. Imagery helps reveal shapes and distributions; altimetry describes topography; other measurements investigate the planet’s physical properties. Comparing them strengthens interpretation. The descriptions accompanying files matter too: knowing which data are being used prevents researchers from attributing precision, geometry or information to a product when those properties actually belong to another set of measurements. Understanding the archive is consequently part of understanding what the observations can establish.
Reading the famous three-dimensional views
The three-dimensional view of Maat Mons identified as PIA00106 provides an instructive example. NASA combines SAR imagery and altimetry to construct a perspective of the terrain. In that particular representation, the vertical scale is exaggerated tenfold and the colours are simulated. It is not a photograph taken by a camera hovering in front of the volcano. It is a visualisation based on real measurements, with declared graphic choices that make structures easier to see. Recognising those transformations allows us to appreciate the image without confusing its explanatory power with a direct optical observation of the landscape.
A volcanic vent that changed shape
In 2023, an analysis of archived observations revealed changes in a vent associated with Maat Mons between February and October 1991. Robert Herrick and Scott Hensley compared images acquired from different directions, also using simulations to assess how viewing geometry affected the result. Changes in the vent’s shape and area were interpreted as evidence of volcanic activity during that interval. The finding did not come from a spacecraft transmitting live observations in 2023. It emerged from a fresh examination of measurements collected more than thirty years earlier, demonstrating the lasting scientific value of archived planetary data.
Lava flows investigated in 2024
In 2024, another team, led by Davide Sulcanese, analysed changes near Sif Mons and in western Niobe Planitia. The comparison involved observations from 1990 and 1992. Increased radar returns along particular structures, considered alongside topography and alternative explanations, were interpreted as newly emplaced lava flows. The result’s strength lies in more than detecting a difference. Researchers examined whether the changes followed slopes and obstacles in ways consistent with flowing material, assessing other possibilities before selecting the interpretation that best explained the observed patterns in the archived radar measurements.
Magellan built on earlier exploration
Radar had been used to investigate Venus before Magellan. Pioneer Venus Orbiter, which entered orbit in 1978, contributed to knowledge of its topography; Soviet Venera missions also formed part of the history of Venus radar mapping. Magellan greatly expanded the available detail and coverage. Exploration often progresses in this way: new instruments address questions left by earlier missions and create more specific ones. A better map does not bring the investigation to an end. It enables comparisons and hypotheses that could not previously be tested using the observations available to researchers.
The mission ended; the archive remains useful
In 1993, Magellan used aerobraking, exploiting interaction with the upper atmosphere to modify its orbit. The mission ended in 1994 with a descent into Venus’s atmosphere. Its measurements nevertheless remained available for further study. Research published in 2023 and 2024 demonstrates why preserving well-documented archives matters alongside building instruments capable of collecting observations. Between an original radio signal and a geological conclusion lie processing, comparisons, models and checks. Following that chain makes Venus easier to understand and reveals why a spacecraft can continue contributing to planetary science long after its operational mission has ended.
Sources and further reading (11)
- science.nasa.gov · venus facts
- nasa.gov · 35 years ago sts 30 launches magellan to venus
- science.nasa.gov · magellan
- science.nasa.gov · get to know sar
- pds-geosciences.wustl.edu · magellan
- jpl.nasa.gov · pia00106 venus 3 d perspective view of maat mons
- jpl.nasa.gov · nasas magellan data reveals volcanic activity on venus
- nasa.gov · ongoing venus volcanic activity discovered with nasas magellan data
- nature.com · s41550 024 02272 1
- nasa.gov · 30 years ago magellan off to map venus
- nasa.gov · magellan mission venus
Sources checked: 2026-11-19.