A dark region, not a punctured star
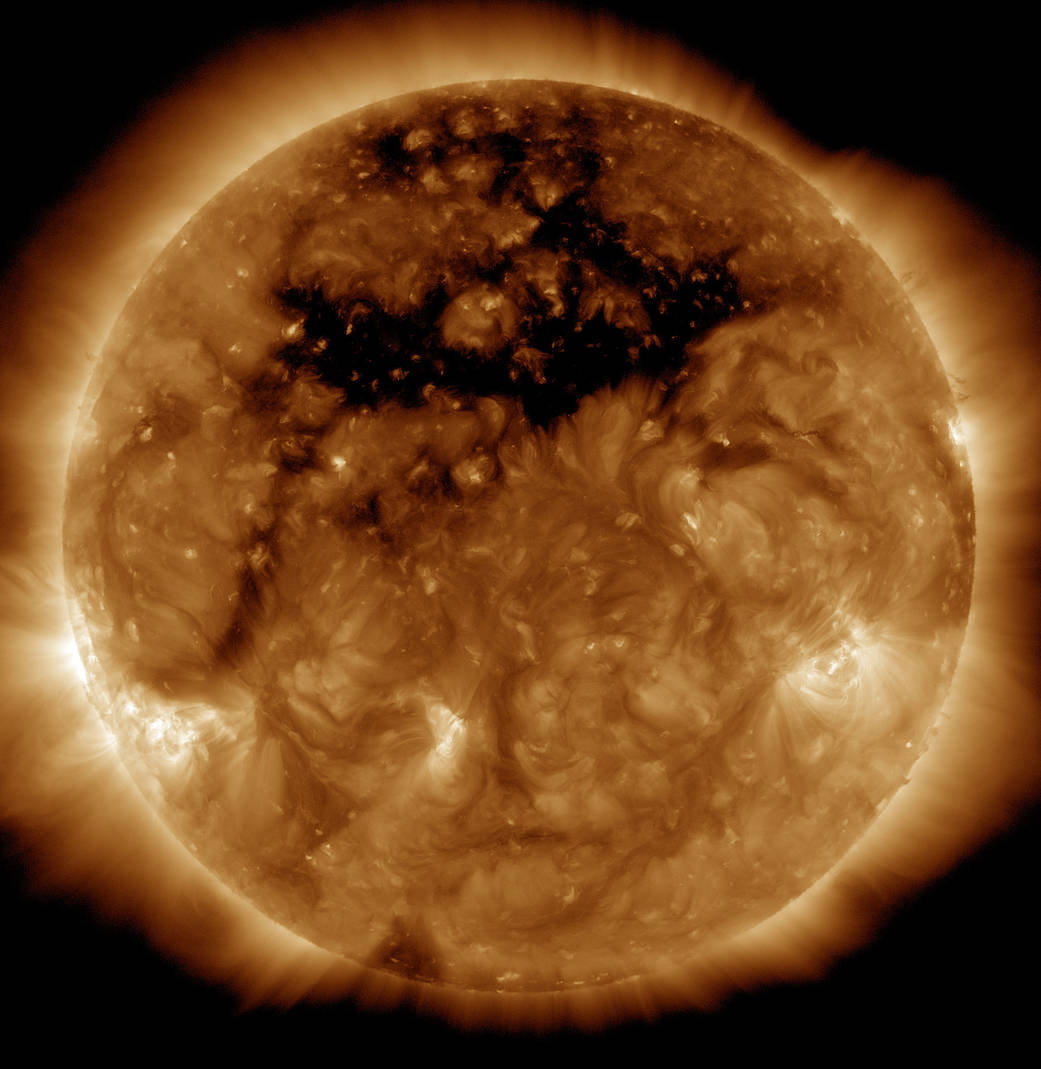
A large dark area in an image of the Sun can look like a tear. A coronal hole, however, is a region of the corona, our star’s outer atmosphere. In extreme ultraviolet and soft X-ray images it appears dimmer than the surrounding plasma because it is less dense and relatively cooler. We are not looking through the Sun, and a piece of its surface has not disappeared. The name describes the appearance in a particular image; the physical explanation involves the temperature, density and magnetic structure of the observed region.
To find our way around the Sun, we need to distinguish its layers. The photosphere is the region from which most visible sunlight emerges; the chromosphere and corona lie above it. The corona reaches temperatures far higher than those of the photosphere, although its material is extremely tenuous. Calling a coronal hole “cooler” therefore compares it with the neighbouring corona, not with a winter’s day on Earth. Confusing images of different layers can make structures with different origins and properties look as though they represent the same physical phenomenon.
What the colours actually show
The Atmospheric Imaging Assembly, or AIA, aboard the Solar Dynamics Observatory observes the solar atmosphere in several wavelength bands. Comparing those observations helps connect visible structures with different physical conditions. Extreme ultraviolet light is invisible to human eyes, so assigned colours are used to display the measurements. A bronze or purple solar image does not mean that the star has changed colour to human vision. Before interpreting a dark region, look for the instrument, observed band and date, just as you would read the legend accompanying a scientific map.
This article’s cover is a real SDO observation from 10 October 2015, presented by NASA in the 193-ångström band, which is usually coloured bronze. The dark area across the upper part is the coronal hole described in the original image record. It is a documented historical example that helps us recognise the structure, rather than a picture of today’s solar conditions.
From magnetic fields to solar wind
The geometry of the magnetic field is central to the explanation. In closed coronal regions, magnetic field lines form loops that return towards the Sun. In coronal holes the configuration opens towards interplanetary space, providing an escape route for solar material. Field lines are a physical representation of the field’s direction, rather than rigid wires attached to the star. Distinguishing open from closed regions helps explain why an image that looks comparatively quiet can still matter when studying the environment through which the planets travel around the Sun.
The solar wind is a stream of plasma, consisting mainly of protons and electrons, that continually flows away from the Sun and carries the interplanetary magnetic field. Coronal holes are sources of fast wind: NOAA describes typical speeds ranging from 500 to 800 kilometres per second. When faster material catches up with slower wind, a compressed interaction region can form. This is not ordinary air blowing through space, and it is not automatically an explosive eruption. It is charged material whose behaviour also depends on the magnetic field travelling with it.
Why a coronal hole is not a sunspot
Sunspots belong to the photosphere and are associated with intense magnetic fields. A spot can have a darker central umbra surrounded by a penumbra. The active regions associated with sunspot groups may instead appear bright in observations of the corona. A dark spot in visible light and a dark coronal hole in ultraviolet light are therefore not interchangeable. Reading solar images requires more than comparing colours: we need to know which layer is being observed and what magnetic measurements accompany the picture. That distinction also matters when assessing headlines about solar activity.
A coronal mass ejection, or CME, is another distinct phenomenon. It involves the expulsion of a large quantity of plasma together with its embedded magnetic field. CMEs can be associated with other manifestations of solar activity, but they are not simply persistent dark regions in solar images. A high-speed stream from a coronal hole and a CME require different analyses of their propagation and effects. Using a single label for both conceals the very characteristics that space-weather specialists need to measure when building a reliable forecast for the near-Earth environment.
When Earth responds
The effects at Earth depend on the interaction between the solar wind and the magnetosphere. Speed is only one factor: the orientation of the magnetic field carried by the wind is especially important. Conditions that favour energy transfer can produce a geomagnetic storm, changing currents and fields in near-Earth space. A large dark area on the Sun cannot, by itself, establish the intensity or consequences of a terrestrial event. Moving from an observation to a forecast requires information about the stream’s structure and the conditions encountered along its path to Earth.
Auroras make part of the Sun–Earth relationship visible. Energetic particles guided by Earth’s magnetic field interact with the upper atmosphere, exciting atoms and molecules that then emit light. The emissions depend on the species involved and the altitude: oxygen and nitrogen contribute different colours. The glow is not a photograph of solar particles burning close to the ground. It results from processes high in the atmosphere that are connected to the magnetosphere’s dynamics. This explanation is more interesting, and much more accurate, than imagining a simple flame travelling all the way from the Sun.
Reading indices without turning them into alarms
The planetary Kp index summarises geomagnetic activity over three-hour intervals using ground-based magnetic observations. It does not measure a coronal hole’s size, and it is not a continuous gauge of the Sun’s power. When reading it, distinguish the available estimated value, the interval it describes and any future prediction. A number displayed in a website’s data bar is useful only if that context remains clear. Frequently refreshing an interface does not change either the cadence or the scientific meaning of the underlying product from which the displayed value was obtained.
NOAA also distinguishes three impact scales: G for geomagnetic storms, S for solar radiation storms and R for radio blackouts. These are not three names for one phenomenon, nor three ratings to add together. Understanding an alert means checking which scale it uses, the stated level and the relevant interval. A useful habit is to begin with the official product description and then return to the solar image. The picture becomes clearer when each piece of information is linked to the particular question that it can actually help us answer.
Sources and further reading (12)
- NOAA · Coronal holes
- NASA · Sun Facts
- NASA/SDO · Instruments
- NASA/SDO · Observation of 10 October 2015
- NASA · The birth of the solar wind
- NOAA · Solar wind
- NOAA · Sunspots and the solar cycle
- NOAA · Coronal mass ejections
- NOAA · Geomagnetic storms
- NASA · Auroras
- NOAA · Planetary K-index
- NOAA · Space weather scales
Sources checked: 2026-11-16.